
Survival Differences After Diagnosis of Early-Onset Colorectal Cancer by Race and Ethnicity and Neighborhood-Level Socioeconomic Status
Abstract
Background
The incidence of early-onset colorectal cancer (eoCRC), diagnosed at age <50 years, is increasing in the United States. Prior studies using national and state cancer databases have observed higher eoCRC mortality after diagnosis among non-Hispanic Black (NHB) patients. These studies, however, often did not account for insurance status, access to care, and comorbidity burden, which may contribute to the observed disparities. We examined the associations between race and ethnicity and neighborhood-level socioeconomic status (measured by the neighborhood deprivation index (NDI)) and survival among persons with eoCRC in a large integrated healthcare delivery system whose racially/ethnically diverse members have standardized access to care.
Methods
We included Kaiser Permanente Southern California (KPSC) members diagnosed with eoCRC (age 15-49 years) between 2009-2020 and followed them through 12/31/2023. Patients with <12 months of prior KPSC membership, an unspecific CRC site, or other/unknown race/ethnicity were excluded. Bivariate and multivariable Cox models were used to estimate hazard ratios (HRs) for the associations between race/ethnicity and NDI and all-cause and CRC-specific mortality. Multivariable models were adjusted for age at diagnosis, sex, Charlson comorbidity score, obesity, stage at diagnosis, cancer site, and histologic subtype. Subgroup analyses were conducted by stage at diagnosis (localized vs. advanced).
Results
Of 1,695 eoCRC cases included, we observed 465 deaths (among those with known cause, 417 (90.3%) were CRC-specific). The mean follow-up time was 6.8 years. In the adjusted models, NHB and non-Hispanic Asian/Pacific Islander (NH API) patients, but not Hispanic patients, had significantly higher all-cause mortality (HR=1.62, 95% CI: 1.14-2.29; HR=1.44 (1.08-1.93), respectively) compared with non-Hispanic White (NHW) patients. In the subgroup analyses, race and ethnicity were not associated with all-cause mortality among patients with localized disease. However, among patients diagnosed with advanced disease, NHB patients had a significantly higher risk of all-cause mortality compared with NHW patients (HR=1.54, 95% CI: 1.07-2.22, p=0.02). Similar findings were observed for CRC-specific mortality, overall and by cancer stage. NDI was not significantly associated with all-cause or CRC-specific mortality.
Conclusions
In this insured population, NHB race and ethnicity were associated with increased risk of CRC-specific mortality among those diagnosed with advanced stage eoCRC. However, the number of NHB patients diagnosed at distant stages was small. Therefore, future research is needed to confirm these findings and better understand potential survival disparities.
Article Information
- Received
- Accepted
- Published
Academic Editor: Anubha Bajaj, Consultant Histopathologist, A.B. Diagnostics, Delhi, India.
Checked for plagiarism: Yes
Review by: Single-blind
Copyright © 2026 Talar S. Habeshian, et al.
 This is an open-access article distributed under the terms of the Creative Commons Attribution License, which permits unrestricted use, distribution, and reproduction in any medium, provided the original author and source are credited.
Corresponding author: Chun R. Chao, Department of Research and Evaluation, Kaiser Permanente Southern California, Pasadena, CA, USA, Department of Health Systems Science, Kaiser Permanente Bernard J. Tyson School of Medicine, Pasadena, CA, USA —
Competing Interests
The authors have declared that no competing interests exist.
Funding
This work was supported by grant# 1R01CA258160 funded by the National Cancer Institute. Chun R. Chao is the recipient of the grant.
Data Availability
Anonymized data that support the findings of this study may be made available from the corresponding author on reasonable requests from qualified researchers with documented evidence of training for human subjects protections.
Citation:
Introduction
The incidence of early-onset colorectal cancer (eoCRC, defined as diagnosed before age 50 years) has been increasing by 2-3% annually in the United States (US). 1, 2, 3, 4, 5, 6 Between 1988 and 2015, the incidence of eoCRC increased by more than 60%, and eoCRC now accounts for approximately 10% of all new CRC diagnoses in the US.1
Compared with CRC diagnosed later in life, patients diagnosed with eoCRC are more likely to present with advanced-stage disease. Their tumors tend to present with more aggressive features, such as distal colon tumors and poorly differentiated, mucinous, or signet ring histology.7 Five-year survival rates vary substantially by stage: approximately 90% for localized disease, 71% for regional disease, and 14% for distant-stage eoCRC.
Several prior population-based studies using national and state cancer registries have observed differences in survival after eoCRC diagnosis by race and ethnicity and socioeconomic status (SES). These studies have consistently reported inferior overall and disease-specific survival among non-Hispanic Black (NHB) patients compared with non-Hispanic White (NHW) patients, despite adjusting for socioeconomic factors.8, 9, 10, 11, 12, 13, 14, 15 Some studies have also reported inferior survival among Hispanic and Native Hawaiian or Pacific Islander patients.8, 9 However, most prior studies do not comprehensively adjust for insurance status, SES factors, lifestyle factors, and comorbidities when evaluating the association between race/ethnicity and survival after eoCRC.
A few prior studies have evaluated the association between neighborhood-level SES and survival among eoCRC patients, and have reported an inverse association between certain neighborhood-level SES measures and mortality after eoCRC diagnosis.11, 14 It remains unclear if the observed difference in eoCRC survival across race and ethnicity and neighborhood-level SES subgroups is explained by confounding by insurance status, access to care, lifestyle factors, or baseline comorbidity; or if the survival differences stem from differences in disease or treatment-related factors, or other care gaps.
A better understanding of the potential mechanisms underlying the survival differences by race/ethnicity and neighborhood-level SES observed in registry-based studies is needed to guide the development of strategies to improve equity in survival outcomes. Here we examined the associations between race and ethnicity and neighborhood deprivation index (NDI) with all-cause and colorectal cancer (CRC)-specific mortality among eoCRC cases in a large integrated healthcare delivery system whose racially/ethnically diverse members have relatively equal access to care to assess whether survival differences persist after accounting for access to health insurance and care.
Materials and Methods
Study Setting & Population
We conducted a retrospective cohort study at Kaiser Permanente Southern California (KPSC). KPSC is an integrated healthcare delivery system that services over 4.7 million members. KPSC members are racially, ethnically, and socioeconomically diverse and are broadly representative of Southern California residents.16
We included KPSC members diagnosed with invasive eoCRC (age 15-49 years) between 2009 and 2020 and followed them through December 31, 2023. EoCRC cases were identified using KPSC’s SEER-affiliated cancer registry. Patients with (1) <12 months of prior KPSC membership, (2) another cancer diagnosis prior to the CRC diagnosis, and (3) an unspecified CRC site were excluded from the analysis. Additionally, we excluded patients with unknown race/ethnicity. Those with less than 12 months of KPSC membership were also excluded to ensure ascertainment of comorbidities.
Data Collection
The outcomes of interest were all-cause mortality and CRC-specific mortality, which were collected from membership files in KPSC’s electronic health records (EHR). Cause of death was obtained using ICD-10 codes and subsequently categorized as CRC-related or not.
Race and ethnicity and NDI, our exposures of interest, were collected from KPSC’s membership file and geocoded data. Race and ethnicity were self-reported and categorized as Non-Hispanic (NH) Asian/Pacific Islander (API), NH Black (NHB), Hispanic, NH White (NHW). NDI was categorized into quartiles from least deprived to most deprived based on the distribution in the study cohort.
Data on CRC characteristics, including date of diagnosis, stage at diagnosis, tumor histology, and anatomic site, were collected from KPSC’s SEER-affiliated cancer registry. All other data were collected from KPSC’s EHR. Demographic and clinical information obtained included age at diagnosis, sex (male, female), length of KPSC membership, body mass index (BMI) (obese: ≥30 kg/m2 vs. not obese: <30 kg/m2; measured using the closest value at or prior to eoCRC diagnosis), and Charlson’s comorbidity score17 (0, 1, >1; measured within 12 months prior to diagnosis).
Statistical Analysis
Descriptive analyses were conducted to evaluate the distribution of demographic and clinical characteristics of the study population by race and ethnicity and NDI using t-tests for continuous variables and Chi-square tests for categorical variables. Kaplan-Meier survival curves for both all-cause and CRC-specific mortality were generated by race and ethnicity and NDI quartiles, overall, and stratified by stage at diagnosis (localized vs. advanced stages). Differences in survival across race and ethnicity and NDI quartiles were assessed using the log-rank test.
Bivariate and multivariable Cox models were used to estimate hazard ratios (HRs) and 95% confidence intervals (CIs) for the associations of race and ethnicity and NDI with all-cause and CRC-specific mortality. Individuals were censored at the end of study follow-up (12/31/2023) for the all-cause mortality outcome; and at the end of study follow-up or death due to non-CRC causes for the CRC-specific mortality outcome. Those with unknown stage at diagnosis (n=7, 0.41%) were excluded from the analysis. Multivariable models adjusted for age at diagnosis, sex, Charlson comorbidity score, obesity, stage at diagnosis, cancer site, and histologic subtype. Subgroup analyses were conducted by stage at diagnosis (localized vs. advanced stages (regional and distant)). All analyses were repeated, restricting to adenocarcinoma only. Rubin’s multiple imputations were used to impute missing values for obesity (n=19).18 All analyses were conducted in SAS statistical software Version 9.4 (Cary, North Carolina, USA).
Results
There were 2,191 KPSC members diagnosed with eoCRC during the study period. Of these individuals, 447 were excluded for having <12 months of KPSC membership prior to their diagnosis, 24 were excluded for having unknown race/ethnicity, and 25 were excluded for missing information on cancer site. Of the 1,695 eoCRC cases included, we observed 465 deaths over a mean follow-up time of 6.8 years (standard deviation (SD) = 3.9) (Table 1 and Table 2). Of these deaths with known causes (462 deaths), 417 (90.3%) were CRC-specific deaths. The mean age at diagnosis for the study cohort was 41.8 years (SD = 6.8).
When examining the eoCRC cases by race and ethnicity, there was a higher proportion of obesity among NHB (51.2%), and Hispanic (46.9%) patients compared to other racial/ethnic groups (Table 1). About a quarter (23.8%) of Hispanic patients were diagnosed with a distant stage tumor, followed by NHW (20.8%), NH API (18.5%), and NHB (16.4%) patients. NHB (64.3%), NHW (60.9%), and Hispanic (60.6%) patients were more likely to be diagnosed with a colon tumor than NH API patients, who were more likely to be diagnosed with a rectal or rectosigmoidal tumor (52.3%). NHB patients had the highest proportion of individuals in the ‘most deprived’ NDI quartile (40.9%), followed by Hispanic patients (37.3%). NHW patients had the highest proportion of individuals in the ‘least deprived’ NDI quartile (39.8%), followed by NH API patients (31.3%) (Table 1). The distributions of sex and comorbidity status did not differ significantly across race and ethnicity (Table 1).
Table 1. Demographic and clinical characteristics of invasive early-onset colorectal cancer cohort by race and ethnicity.| Race and Ethnicity | ||||||
| Non-Hispanic Asian/Pacific Islander | Non-Hispanic Black | Hispanic | Non-Hispanic White | Total | P Value | |
| (N=243) | (N=171) | (N=705) | (N=576) | (N=1695) | ||
| Age at diagnosis, mean (SD) | 42.6 (5.7) | 43.1 (6.1) | 41.2 (7.0) | 41.8 (7.0) | 41.8 (6.8) | <0.01 |
| Sex | 0.12 | |||||
| Female | 125 (51.4%) | 100 (58.5%) | 351 (49.8%) | 277 (48.1%) | 853 (50.3%) | |
| Male | 118 (48.6%) | 71 (41.5%) | 354 (50.2%) | 299 (51.9%) | 842 (49.7%) | |
| Neighborhood Deprivation Index | <0.01 | |||||
| Quartile 1 (least deprived) | 76 (31.3%) | 22 (12.9%) | 85 (12.1%) | 229 (39.8%) | 412 (24.3%) | |
| Quartile 2 | 69 (28.4%) | 36 (21.1%) | 149 (21.1%) | 173 (30.1%) | 427 (25.2%) | |
| Quartile 3 | 58 (23.9%) | 43 (25.2%) | 208 (29.5%) | 113 (19.7%) | 422 (24.9%) | |
| Quartile 4 (most deprived) | 40 (16.5%) | 70 (40.9%) | 263 (37.3%) | 60 (10.4%) | 433 (25.6%) | |
| Obesity | <0.01 | |||||
| No | 194 (80.8%) | 83 (48.8%) | 370 (53.1%) | 377 (66.3%) | 1024 (61.1%) | |
| Yes | 46 (19.2%) | 87 (51.2%) | 327 (46.9%) | 192 (33.7%) | 652 (38.9%) | |
| Charlson's comorbidity score | 0.50 | |||||
| Charlson score = 0 | 178 (73.3%) | 119 (69.6%) | 500 (70.9%) | 430 (74.7%) | 1227 (72.4%) | |
| Charlson score = 1 | 52 (21.4%) | 45 (26.3%) | 159 (22.6%) | 118 (20.5%) | 374 (22.1%) | |
| Charlson score >1 | 13 (5.3%) | 7 (4.1%) | 46 (6.5%) | 28 (4.9%) | 94 (5.6%) | |
| SEER Tumor Stage | 0.10 | |||||
| Localized | 95 (39.1%) | 85 (49.7%) | 293 (41.6%) | 228 (39.6%) | 701 (41.4%) | |
| Regional | 101 (41.6%) | 58 (33.9%) | 242 (34.3%) | 225 (39.1%) | 626 (36.9%) | |
| Distant | 45 (18.5%) | 28 (16.4%) | 168 (23.8%) | 120 (20.8%) | 361 (21.3%) | |
| Tumor Site | <0.01 | |||||
| Colon right side | 37 (15.2%) | 49 (28.7%) | 162 (23.0%) | 142 (24.7%) | 390 (23.0%) | |
| Colon left side | 71 (29.2%) | 48 (28.1%) | 235 (33.3%) | 188 (32.6%) | 542 (32.0%) | |
| Rectum & rectosigmoid | 127 (52.3%) | 61 (35.7%) | 278 (39.4%) | 225 (39.1%) | 691 (40.8%) | |
| Transverse colon | 8 (3.3%) | 13 (7.6%) | 30 (4.3%) | 21 (3.7%) | 72 (4.2%) | |
| Histology type, n (%) | 0.04 | |||||
| Adenocarcinoma | 205 (84.4%) | 136 (79.5%) | 576 (81.7%) | 501 (87.0%) | 1418 (83.7%) | |
| Neuroendocrine | 36 (14.8%) | 33 (19.3%) | 126 (17.9%) | 68 (11.8%) | 263 (15.5%) | |
| Sarcoma/Squamous/Other | 2 (0.8%) | 2 (1.2%) | 3 (0.42%) | 7 (1.2%) | 14 (0.8%) | |
| All-cause mortality by the end of 2023 | 0.85 | |||||
| No | 175 (72.0%) | 125 (73.1%) | 505 (71.6%) | 425 (73.8%) | 1230 (72.6%) | |
| Yes | 68 (28.0%) | 46 (26.9%) | 200 (28.4%) | 151 (26.2%) | 465 (27.4%) | |
| CRC-specific mortality by end of 2023 | 0.85 | |||||
| No | 183 (75.6%) | 130 (76.0%) | 523 (74.3%) | 439 (76.3%) | 1275 (75.4%) | |
| Yes | 59 (24.4%) | 41 (24.0%) | 181 (25.7%) | 136 (23.7%) | 417 (24.6%) | |
When examining the eoCRC cases by NDI quartiles, there were more NH API and NHW patients in the least deprived quartiles of NDI: NH API 18.5% and NHW 55.6% vs. NHB 5.3% and Hispanic 20.6%, while there were more NHB and Hispanic patients in the most deprived quartiles: NH API 9.2% and NHW 13.9% vs. NHB 16.2% and Hispanic 60.7% (Table 2). There was a higher proportion of obesity among the more deprived subgroups compared to the least deprived quartile. The distributions of comorbidity status, stage at diagnosis, tumor site, and histology type did not differ significantly between NDI quartiles (Table 2).
Table 2. Demographic and clinical characteristics of invasive early-onset colorectal cancer cohort by neighborhood deprivation index.| Neighborhood Deprivation Index | ||||||
| Quartile 1 (Least Deprived) | Quartile 2 (Less Deprived) | Quartile 3 (More Deprived) | Quartile 4 (Most Deprived) | Total | PValue | |
| (N=412) | (N=427) | (N=422) | (N=433) | (N=1694) | ||
| Age at Diagnosis, Mean (SD) | 42.3 (6.65) | 42.2 (6.51) | 41.9 (6.31) | 40.8 (7.48) | 41.8 (6.77) | 0.01 |
| Sex | 0.56 | |||||
| Female | 213 (51.70%) | 214 (50.12%) | 219 (51.90%) | 206 (47.58%) | 852 (50.30%) | |
| Male | 199 (48.30%) | 213 (49.88%) | 203 (48.10%) | 227 (52.42%) | 842 (49.70%) | |
| Race and Ethnicity | <0.01 | |||||
| Non-Hispanic Asian/ Pacific Islander | 76 (18.45%) | 69 (16.16%) | 58 (13.74%) | 40 (9.24%) | 243 (14.34%) | |
| Non-Hispanic Black | 22 (5.34%) | 36 (8.43%) | 43 (10.19%) | 70 (16.17%) | 171 (10.09%) | |
| Hispanic | 85 (20.63%) | 149 (34.89%) | 208 (49.29%) | 263 (60.74%) | 705 (41.62%) | |
| Non-Hispanic White | 229 (55.58%) | 173 (40.52%) | 113 (26.78%) | 60 (13.86%) | 575 (33.94%) | |
| Other/Unknown | 76 (18.45%) | 69 (16.16%) | 58 (13.74%) | 40 (9.24%) | 243 (14.34%) | |
| Obesity | <0.01 | |||||
| No | 290 (70.90%) | 262 (62.53%) | 230 (55.02%) | 241 (56.18%) | 1023 (61.07%) | |
| Yes | 119 (29.10%) | 157 (37.47%) | 188 (44.98%) | 188 (43.82%) | 652 (38.93%) | |
| Charlson's Comorbidity Score | 0.36 | |||||
| Charlson score = 0 | 314 (76.21%) | 298 (69.79%) | 306 (72.51%) | 308 (71.13%) | 1226 (72.37%) | |
| Charlson score = 1 | 77 (18.69%) | 107 (25.06%) | 94 (22.27%) | 96 (22.17%) | 374 (22.08%) | |
| Charlson score >1 | 21 (5.10%) | 22 (5.15%) | 22 (5.21%) | 29 (6.70%) | 94 (5.55%) | |
| SEER Tumor Stage | 0.27 | |||||
| Localized | 159 (38.59%) | 182 (42.62%) | 171 (40.52%) | 188 (43.42%) | 700 (41.32%) | |
| Regional | 172 (41.75%) | 144 (33.72%) | 157 (37.20%) | 153 (35.33%) | 626 (36.95%) | |
| Distant | 80 (19.42%) | 100 (23.42%) | 90 (21.33%) | 91 (21.02%) | 361 (21.31%) | |
| Tumor Site | 0.55 | |||||
| Colon right side | 126 (30.58%) | 135 (31.62%) | 144 (34.12%) | 137 (31.64%) | 542 (32.00%) | |
| Colon left side | 101 (24.51%) | 94 (22.01%) | 88 (20.85%) | 107 (24.71%) | 390 (23.02%) | |
| Rectum & rectosigmoid | 170 (41.26%) | 172 (40.28%) | 176 (41.71%) | 172 (39.72%) | 690 (40.73%) | |
| Transverse colon | 15 (3.64%) | 26 (6.09%) | 14 (3.32%) | 17 (3.93%) | 72 (4.25%) | |
| Histology Type, n (%) | 0.65 | |||||
| Adenocarcinoma | 343 (83.25%) | 360 (84.31%) | 356 (84.36%) | 359 (82.91%) | 1418 (83.71%) | |
| Neuroendocrine | 63 (15.29%) | 64 (14.99%) | 65 (15.40%) | 70 (16.17%) | 262 (15.47%) | |
| Sarcoma/Squamous/Other | 6 (1.46%) | 3 (0.70%) | 1 (0.24%) | 4 (0.92%) | 14 (0.83%) | |
| All-cause mortality by the end of 2023 | 0.95 | |||||
| No | 295 (71.60%) | 310 (72.60%) | 306 (72.51%) | 318 (73.44%) | 1229 (72.55%) | |
| Yes | 117 (28.40%) | 117 (27.40%) | 116 (27.49%) | 115 (26.56%) | 465 (27.45%) | |
| CRC-specific mortality by end of 2023 | 0.96 | |||||
| No | 310 (75.61%) | 319 (74.71%) | 316 (74.88%) | 329 (76.16%) | 1274 (75.34%) | |
| Yes | 100 (24.39%) | 108 (25.29%) | 106 (25.12%) | 103 (23.84%) | 417 (24.66%) | |
Figure 1. Kaplan-Meier survival curves for all-cause mortality and CRC-specific mortality, overall and by stage at diagnosis, by race and ethnicity.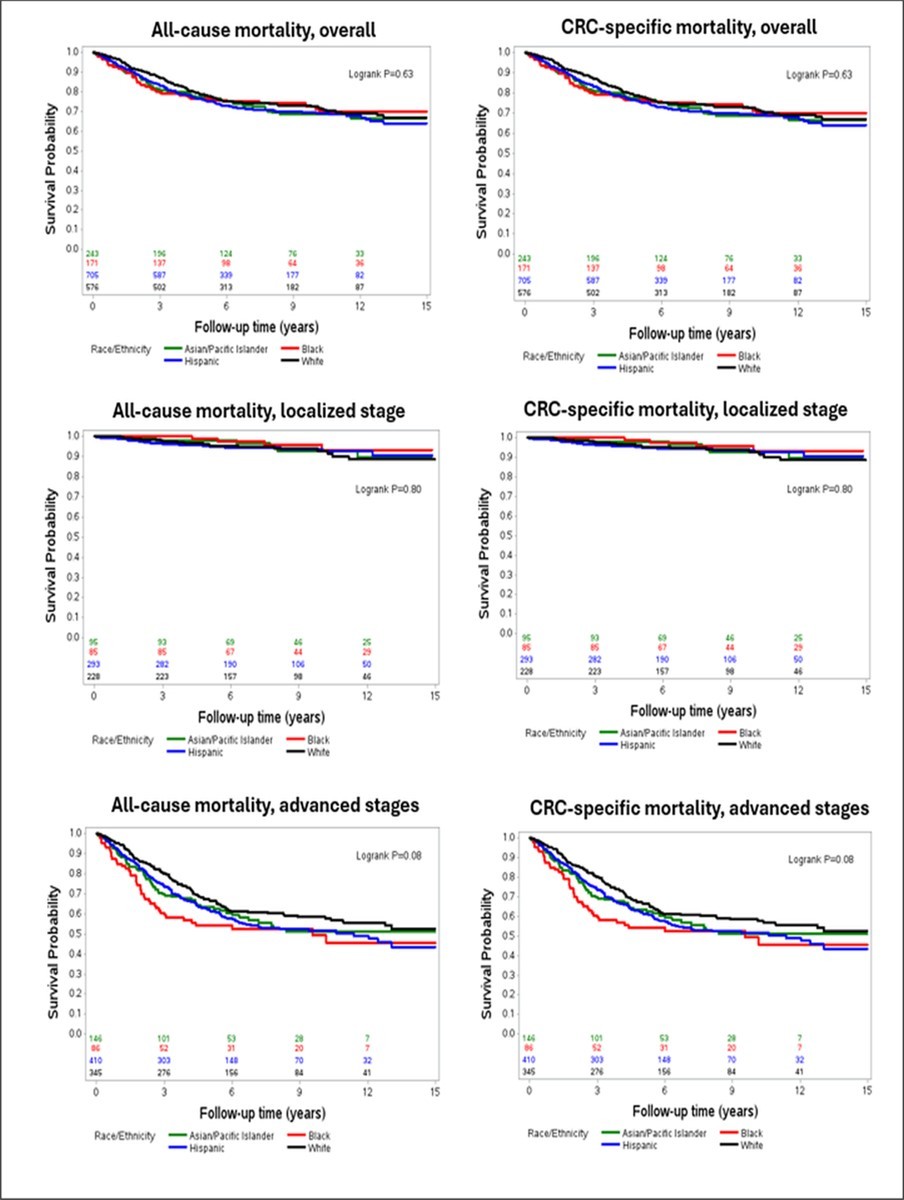
Download figure
Figure 1 shows the Kaplan-Meier survival curves by race and ethnicity, overall and by stage at diagnosis. No clear difference was seen across racial/ethnic subgroups for overall and localized diseases. Among those with advanced stage diseases, NHB appeared to have poorer survival, although the overall difference in survival across race and ethnicity was not statistically significant (log-rank p-value=0.08). In the crude Cox models, there were no significant differences in all-cause mortality when comparing NH API, NHB, and Hispanic patients to NHW patients (HRNH API = 1.12, 95% CI: 0.84-1.49; HRNHB = 1.04, 95% CI: 0.75-1.44; HRHispanic = 1.15, 95% CI: 0.93-1.41). The results were similar for CRC-specific death (Table 3). However, in the adjusted models, NH API and NHB patients, but not Hispanic patients, had significantly higher all-cause mortality (HRNH API = 1.44, 95% CI: 1.08-1.93, p = 0.01; HRNHB = 1.62, 95% CI: 1.14-2.29, p = 0.01) compared with NHW patients (Table 3). Similarly, NHB and NH API patients, but not Hispanic patients, had significantly higher CRC-specific death rates compared with NHW patients (Table 3). The change between the crude and adjusted estimates for NH API and NHB was primarily due to adjustment by stage at diagnosis.
Kaplan-Meier survival curves by NDI quartiles were provided in Supplemental Figure 1, showing no clear difference between subgroups. In both the crude and adjusted models, there were no significant differences in all-cause or CRC-specific mortality when comparing those in the more deprived NDI Quartiles (Quartiles 2-4) to the least deprived quartile (Quartile 1) (adjusted all-cause mortality: HRQuartile 4= 0.80, 95% CI: 0.60, 1.07; CRC-specific death: HRQuartile 4 = 0.85, 95% CI: 0.63, 1.15) (Table 3).
Table 3. Cox regression models for all-cause mortality and colorectal cancer (CRC)-specific death among early-onset CRC patients.| All-Cause Mortality | CRC-Specific Mortality | |||||||||
| N | Crude | Adjusted* | N | Crude | Adjusted* | |||||
| HR 95% CI | P | HR 95% CI | P | HR 95% CI | P | HR 95% CI | P | |||
| Race and ethnicity | All histology | |||||||||
| Non-Hispanic White | 151 | ref | - | ref | - | 136 | ref | - | ref | - |
| NH-Asian/Pacific Islander | 68 | 1.12(0.84-1.49) | 0.44 | 1.44(1.08-1.93) | 0.01 | 59 | 1.08(0.80-1.46) | 0.62 | 1.42(1.04-1.94) | 0.03 |
| Non-Hispanic Black | 46 | 1.04(0.75-1.44) | 0.83 | 1.62(1.14-2.29) | 0.01 | 41 | 1.03(0.73-1.47) | 0.85 | 1.62(1.12-2.35) | 0.01 |
| Hispanic | 200 | 1.15(0.93-1.41) | 0.21 | 1.10(0.87-1.39) | 0.42 | 181 | 1.15(0.92-1.43) | 0.23 | 1.09(0.86-1.40) | 0.47 |
| Neighborhood Deprivation Index | ||||||||||
| Quartile 1 (least deprived) | 117 | ref | - | ref | - | 100 | ref | - | ref | - |
| Quartile 2 | 117 | 0.98(0.76-1.26) | 0.87 | 0.83(0.63-1.08) | 0.16 | 108 | 1.05(0.80-1.37) | 0.74 | 0.88(0.67-1.17) | 0.38 |
| Quartile 3 | 116 | 1.00(0.78-1.30) | 0.97 | 0.84(0.64-1.11) | 0.21 | 106 | 1.06(0.81-1.40) | 0.66 | 0.90(0.67-1.20) | 0.46 |
| Quartile 4 (most deprived) | 115 | 0.93(0.72-1.20) | 0.56 | 0.80(0.61-1.06) | 0.13 | 103 | 0.97(0.74-1.28) | 0.82 | 0.85(0.63-1.15) | 0.30 |
| Race and ethnicity | Adenocarcinoma only | |||||||||
| NH-White | 145 | ref | - | ref | 132 | ref | - | ref | - | |
| NH-Asian/Pacific Islander | 65 | 1.18(0.88-1.58) | 0.27 | 1.48(1.10-2.00) | 0.01 | 57 | 1.14(0.83-1.55) | 0.42 | 1.44(1.05-1.98) | 0.02 |
| NH-Black | 41 | 1.06(0.75-1.51) | 0.72 | 1.56(1.08-2.25) | 0.02 | 38 | 1.09(0.76-1.56) | 0.64 | 1.59(1.09-2.33) | 0.02 |
| Hispanic | 190 | 1.23(0.99-1.52) | 0.06 | 1.09(0.86-1.38) | 0.49 | 175 | 1.24(0.99-1.55) | 0.07 | 1.09(0.85-1.40) | 0.49 |
| Neighborhood Deprivation Index | ||||||||||
| Quartile 1 (least deprived) | 110 | ref | - | Ref | 96 | Ref | - | Ref | - | |
| Quartile 2 | 114 | 1.02(0.79-1.33) | 0.86 | 0.83(0.63-1.09) | 0.17 | 105 | 1.07(0.81-1.41) | 0.64 | 0.87(0.65-1.16) | 0.34 |
| Quartile 3 | 109 | 0.99(0.76-1.29) | 0.94 | 0.82(0.62-1.09) | 0.18 | 102 | 1.05(0.80-1.39) | 0.73 | 0.88(0.66-1.19) | 0.42 |
| Quartile 4 (most deprived) | 108 | 0.93(0.72-1.22) | 0.62 | 0.80(0.60-1.07) | 0.14 | 99 | 0.98(0.74-1.30) | 0.88 | 0.85(0.63-1.15) | 0.30 |
In the subgroup analyses, among persons diagnosed with localized eoCRC, race and ethnicity were not associated with all-cause mortality (HRNH API = 0.94, 95% CI: 0.35-2.49; HRNHB = 0.85, 95% CI: 0.27-2.73, HRHispanic = 1.15, 95% CI: 0.55-2.40 in comparison to NHW) (Table 4). Similarly, race and ethnicity were not associated with CRC-specific death among patients with localized disease. Among patients diagnosed with advanced stages, NHB patients had a significantly higher risk of all-cause mortality compared with NHW patients (HRNHB = 1.54, 95% CI: 1.07-2.22, p=0.02). Similar findings were observed for CRC-specific mortality (Table 4). Similar findings were observed for CRC-specific death (Table 4). NDI was not associated with all-cause mortality or CRC-specific death across cancer stage at diagnosis (Table 4).
When analyses were restricted to patients with adenocarcinoma only, overall and by stage-at-diagnosis results were similar to those observed in analyses including all histologic subtypes.
Table 4. Multivariable Cox regression models for all-cause mortality and colorectal cancer (CRC)-specific death among early-onset CRC patients by stage at diagnosis.| All-Cause Mortality | CRC-Specific Mortality | ||||||||||||
| Localized | Advanced | Localized | Advanced | ||||||||||
| N | HR 95% CI | P | N | HR 95% CI | P | N | HR 95% CI | P | N | HR 95% CI | P | ||
| All histology | |||||||||||||
| Race and ethnicity | |||||||||||||
| NH-White | 16 | ref | - | 135 | 10 | ref | - | 126 | |||||
| NH-Asian/ Pacific Islander | 6 | 0.94(0.35-2.49) | 0.90 | 62 | 1.29(0.95-1.75) | 0.10 | 4 | 1.00(0.29-3.40) | 1.00 | 55 | 1.22(0.89-1.68) | 0.22 | |
| NH-Black | 4 | 0.85(0.27-2.73) | 0.79 | 42 | 1.54(1.07-2.22) | 0.02 | 2 | 0.62(0.12- 3.14) | 0.57 | 39 | 1.50(1.03-2.19) | 0.04 | |
| Hispanic | 19 | 1.15(0.55-2.40) | 0.70 | 181 | 1.22(0.96-1.56) | 0.10 | 12 | 1.23(0.48- 3.16) | 0.66 | 169 | 1.21(0.94-1.56) | 0.13 | |
| Neighborhood Deprivation Index | |||||||||||||
| Quartile 1 (least deprived) | 11 | ref | - | 106 | 5 | ref | - | 95 | |||||
| Quartile 2 | 15 | 1.45(0.64-3.28) | 0.38 | 102 | 0.96(0.73-1.27) | 0.79 | 12 | 2.64(0.88- 7.91) | 0.08 | 96 | 0.99(0.74-1.33) | 0.97 | |
| Quartile 3 | 7 | 0.87(0.32-2.37) | 0.78 | 109 | 0.98(0.74-1.30) | 0.88 | 3 | 0.83(0.18- 3.72) | 0.80 | 103 | 1.03(0.76-1.38) | 0.86 | |
| Quartile 4 (most deprived) | 12 | 1.16(0.46-2.94) | 0.76 | 103 | 0.86(0.64-1.16) | 0.32 | 8 | 2.03(0.56- 7.33) | 0.28 | 95 | 0.90(0.66-1.22) | 0.49 | |
| Adenocarcinoma only | |||||||||||||
| Race and ethnicity | |||||||||||||
| NH-White | 14 | ref | - | 131 | ref | - | 9 | ref | - | 123 | ref | - | |
| NH-Asian/Pacific Islander | 4 | 0.88(0.28-2.82) | 0.83 | 61 | 1.32(0.97-1.79) | 0.08 | 3 | 0.94(0.23- 3.79) | 0.93 | 54 | 1.23(0.89-1.71) | 0.21 | |
| NH-Black | 3 | 0.67(0.17-2.59) | 0.56 | 38 | 1.48(1.01-2.17) | 0.04 | 2 | 0.67(0.13-3.61) | 0.64 | 36 | 1.46(0.99-2.16) | 0.06 | |
| Hispanic | 16 | 1.10(0.49-2.44) | 0.82 | 174 | 1.22(0.95-1.56) | 0.11 | 11 | 1.14(0.43-3.06) | 0.79 | 164 | 1.22(0.94-1.57) | 0.13 | |
| Neighborhood Deprivation Index | |||||||||||||
| Quartile 1 (least deprived) | 8 | ref | - | 102 | ref | - | 4 | ref | - | 92 | ref | - | |
| Quartile 2 | 13 | 1.76(0.69-4.44) | 0.23 | 101 | 0.97(0.73-1.29) | 0.85 | 10 | 3.06(0.89-10.46) | 0.08 | 95 | 1.00(0.75-1.35) | 0.99 | |
| Quartile 3 | 6 | 0.92(0.30-2.83) | 0.89 | 103 | 0.95(0.71-1.27) | 0.75 | 3 | 1.07(0.22-5.29) | 0.94 | 99 | 1.01(0.75-1.37) | 0.93 | |
| Quartile 4 (most deprived) | 10 | 1.31(0.45-3.81) | 0.62 | 98 | 0.86(0.64-1.17) | 0.34 | 8 | 2.75(0.67-11.27) | 0.16 | 91 | 0.89(0.65-1.22) | 0.48 | |
Discussion
In this racially and ethnically diverse cohort of persons with eoCRC within a large integrated health care delivery system, NH API and NHB patients had a 44% and 62% higher risk of all-cause mortality, respectively, compared with NHW patients, after comprehensively adjusting for sociodemographic and clinical factors. When stratified by stage at diagnosis, NHB race and ethnicity were associated with increased mortality risk compared with NHW among those diagnosed with advanced stage eoCRC. In contrast, NDI was not associated with mortality outcomes in this cohort. Notably, the majority (90.3%) of deaths in our study population were CRC-specific deaths. Therefore, findings for all-cause mortality largely reflect findings for CRC-specific mortality. The persistence of survival difference by race and ethnicity after adjustment for clinical prognostic factors despite relatively equal access to healthcare among members within the KPSC suggests that factors beyond healthcare access, socioeconomic status, comorbidity status, and lifestyle factors may contribute to the observed inequities.
Previous studies using national or state cancer registries have demonstrated racial and ethnic differences in survival among eoCRC patients. A recent study using data from the Surveillance, Epidemiology, and End Results Program (SEER) reported that 5-year relative survival for eoCRC was 69.1% for White, 66.5% for Asian/Pacific Islander, 63.1% for Hispanic, and 57.6% for Black patients.8 These differences persisted after adjusting for demographics and cancer characteristics. Additionally, Black and Hispanic patients were significantly associated with higher all-cause mortality after adjusting for demographics, county-level median household income, and cancer characteristics. Another study using California Cancer Registry data reported that NHB patients had significantly higher CRC-specific mortality compared with NHW patients, after adjusting for age at diagnosis, tumor size, neighborhood SES, and urban-rural status.9 Several other studies using the National Cancer Database and SEER found that Black patients had significantly worse overall survival than White patients, even in some of the studies that adjusted for neighborhood-level SES, insurance status, and clinical factors.11, 12, 13, 14, 15 These prior studies included heterogeneous populations from different health care settings and geographic locations. We extended this literature by evaluating survival differences by race and ethnicity within a single integrated health care delivery system in Southern California, and similarly observed inferior survival among NHB patients.
Of note, when we evaluated the difference by stage at diagnosis, the observed statistically significant survival disadvantage for NHB patients was limited to those diagnosed with advanced stages. To this end, most prior studies did not stratify by stage at diagnosis. Our results are in line with a prior study using the National Cancer Database that found NHB patients with stage III eoCRC had a 17% higher risk of death compared with NHW patients, adjusted for sex, treatment, and other clinical factors.10 These findings suggest that racial and ethnic differences may be most pronounced in advanced disease settings, potentially reflecting differences in tumor biology, treatment response, or tolerance to treatment at later stages. That said, due to the generally favorable outcomes of localized stage CRC, the analysis for localized disease was based on a small number of deaths and may be underpowered statistically. Therefore, the lack of racial/ethnic disparity among localized diseases should be interpreted with caution.
We also observed an increased mortality among NH API patients compared with NHW patients in the overall analysis, yet when stratified by stage at diagnosis, no statistically significant increase in mortality risk was observed for NH API for both localized and advanced stage diseases. Prior studies mostly did not report increased mortality risk for NH API patients, except one study that reported significantly higher CRC-specific mortality among Native Hawaiian or Pacific Islander patients.9 Native Hawaiian or Pacific Islander patients were a small minority of our eoCRC patient population; our NH API subgroup consisted mostly of Asian patients. Thus, our finding about the NH API group was surprising and requires confirmation.
Several mechanisms may be underlying the observed differences among NHB, NH API, and NHW patients with advanced disease. For example, tumor biology may differ by race and ethnicity. Prior research has identified a higher prevalence of microsatellite instability and somatic mutations in colorectal tumors among NHB patients compared to NHW patients.12 Therefore, it is possible that NHB patients are not responding as well to standard treatment protocols upon diagnosis of eoCRC as patients from other racial and ethnic backgrounds.
We did not observe an association between NDI and mortality outcomes within this health care setting. This finding contrasts with prior studies that reported income-related survival disparities in eoCRC.11 These findings suggest that relatively equal healthcare access mitigates the impact of SES-related barriers to care, such as diagnosis delays, inadequate treatment, or lack of follow-up care.
Our study had several limitations that should be considered. First, the numbers of NHB and NH API patients were relatively small in our study cohort. Second, we did not have direct measures of individual-level SES. Third, although we adjusted for key clinical factors, there may be additional mechanisms underlying the observed disparities that we did not measure and require further research, such as potential differences in treatment protocols, treatment adherence, and follow-up care. Finally, the findings from our study may not be generalizable to those who are uninsured, or those in other health care settings. However, our goal was to shed light on potential reasons underlying the previously observed survival difference; thus the use of a homogeneous population was critical. Despite the limitations, our study had several strengths, including the use of a racially and ethnically diverse cohort of eoCRC patients within an integrated health care delivery system with relatively equal access, comprehensive data capture on demographic, clinical, and neighborhood-level SES characteristics from EHR, and the adjustment of multiple factors previously not accounted for, such as obesity status.
In this study, we observed inferior survival among NHB patients compared with NHW patients with eoCRC. Our results point to a potential role of tumor- or treatment-related factors in the observed survival difference. The absence of NDI-related differences suggests that a care model emphasizing equity in access will likely help overcome SES-related barriers. Therefore, future research is needed to address the survival difference experienced by NHB patients with eoCRC.
Ethics Approval Statement
This study was approved by Kaiser Permanente Southern California’s Institutional Review Board.
Patient Consent Statement
The requirement for informed consent was waived by Kaiser Permanente Southern California’s Institutional Review Board.
Supplementary Material
References
- 1.Cancer National. National Cancer Institute; (2019) Institute. SEER Cancer Statistics Review (CSR), 1975–2015: Colon and Rectum Cancer. , Bethesda, MD:
- 2.Wang Z, Yao W, Wu W. (2024) Global incidence trends of early-onset colorectal cancer and related exposures in early-life: an ecological analysis based on the GBD 2019. Front Public Health. 12, 1367818.
- 3.Sung H, Siegel R L, Rosenberg P S, Jemal A. (2019) Emerging cancer trends among young adults in the USA: analysis of a population-based cancer registry. Lancet Public Health. 4(3), 137-147.
- 4.Medici B, Riccò B, Caffari E. (2023) Early Onset Metastatic Colorectal Cancer: Current Insights and Clinical Management of a Rising Condition. Cancers. , (Basel) 15-13.
- 5. (2001) Trends in the incidence of early-onset colorectal cancer. in all 50 United States from 128(2), 299-310.
- 6.Siegel R L, Wagle N S. (2023) Cercek A et al. Colorectal cancer statistics. CA Cancer J Clin 73(3), 233-254.
- 7.Wang R, Wang M J, Ping J. (1988) Clinicopathological Features and Survival Outcomes of Colorectal Cancer in Young Versus Elderly:. , Medicine (Baltimore), A Population-Based Cohort Study of SEER 9 Registries Data 94(35), 1402.
- 8.Zaki T A, Liang P S, May F P, Murphy C C. (2023) . Racial and Ethnic Disparities in Early-Onset Colorectal Cancer Survival. Clin Gastroenterol Hepatol 21(2), 497-506.
- 9.Demb J, Gomez S L, Canchola A J. (2024) . Racial and Ethnic Variation in Survival in Early-Onset Colorectal Cancer. JAMA Netw Open 7(11), 2446820.
- 10.Beauharnais C C, Crawford A, Springer J E. (2024) Racial disparities in survival of early onset colon cancer (Age<50): A matched NCDB analysis. Am J Surg 228-141.
- 11.Salem M E, Puccini A, Trufan S J. (2021) . Impact of Sociodemographic Disparities and Insurance Status on Survival of Patients with Early-Onset Colorectal Cancer. Oncologist 26(10), 1730-1741.
- 12.Holowatyj A N, Ruterbusch J J, Rozek L S. (2016) Racial/Ethnic Disparities in Survival Among Patients With Young-Onset Colorectal Cancer. J Clin Oncol 34(18), 2148-2156.
- 13.McClelland P H, Liu T, Ozuner G. (2022) Early-Onset Colorectal Cancer. in Patients under 50 Years of Age: Demographics, Disease Characteristics, and Survival. Clin Colorectal Cancer 21(2), 135-144.
- 14.Aloysius M M, Goyal H, Shah N J. (2021) . Impact of Race and Socioeconomics Disparities on Survival in Young-Onset Colorectal Adenocarcinoma-A SEER Registry Analysis. Cancers , (Basel) 13-13.
- 15.Kamath S D, Torrejon N, Wei W. (2021) Racial disparities negatively impact outcomes in early-onset colorectal cancer independent of socioeconomic status. Cancer Med. 10(21), 7542-7550.
- 16.Koebnick C, Langer-Gould A M, Gould M K. (2012) Sociodemographic characteristics of members of a large, integrated health care system: comparison with US Census Bureau data. Perm J. 16(3), 37-41.